Creating a rainbow map of Brazil for Pride month in R
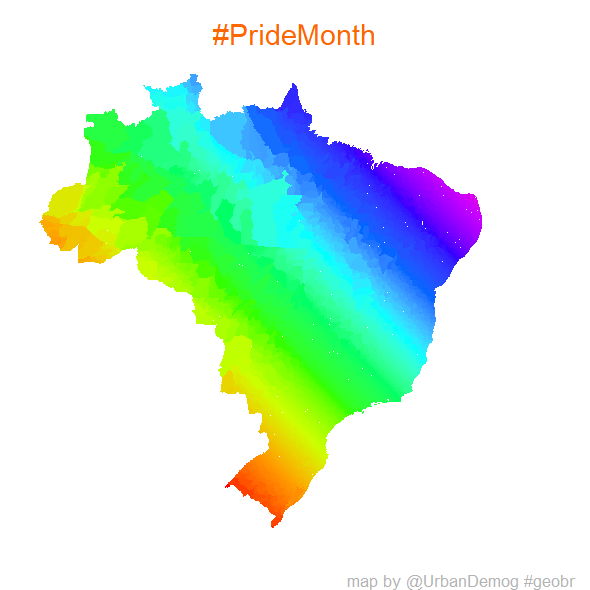
To celebrate Pride month with my friends, I’d like to share this piece of code in R to create a rainbow map of Brazil using data from the geobr package.
library(geobr)
library(ggplot2)
library(sf)
library(sfheaders)

df <- read_municipality(year=2018)
centrd <- st_centroid(df)

centrd <- sfheaders::sf_to_df(centrd, fill=T)
df$position <- centrd$y + centrd$x

ggplot() +
  geom_sf(data=df, aes(fill=position), color=NA) +
  scale_fill_gradientn(colours = rainbow(10)) +
  theme_void() +
  theme(legend.position = "none",
        plot.title = element_markdown(color='#fe6700', size=7, hjust = 0.5),
        plot.caption = element_markdown(color='gray70', size=4)) +
  labs(title= '#PrideMonth',
       caption='map by @UrbanDemog #geobr')

ggsave('pridemonth.png', dpi=300, width = 5, height=5, units='cm')