10th Anniversary of Urban Demographics!
🎂
It feels like I created the Urban Demographics blog a long time ago. My motivation was to create a personal repository of interesting and funny things I find on the web related to my research interests. Ten years, a marriage, a PhD, three cities and a dog later, my procrastination activity on the blog and on
Twitter is still quite rewarding, more than I could expect really. It has helped me learn about the work of many incredible researchers from across the globe. Perhaps more importantly, the blog has helped me get to know some really nice people, a few of whom have become co-authors and friends. I like to think the blog has also helped others as well.
By the stats of the blog, I’m glad to see a few people still find it useful too. Here are just some quick stats that show a summary of the blog over the past year.
- 82 posts, an average of ~1.6 posts per week
- 24,113 (21,476 + 2,637) visits, an average of ~66 visits per day
- 11,810 followers on Twitter
- 3,475 likes/followers on Facebook
- 682 RSS feed subscribers
The 5 most popular posts:
- geobr: shapefiles and official spatial data sets of Brazil in R
- Creating an animated gif of public transport networks using GTFS data
- New home: Urban Demographics 2.0
- Webinar series: Researching Transport Inequalities in Global South Cities
- The Access to Opportunities Project, live webinar with preliminary results
and 5 of my favorite posts:
- Why cities should focus on promoting accessibility, not mobility
- Building up or spreading out? Urban growth across 478 cities
- The Build-up of OpenStreetMap data in East Asia
- Interactive visualization of large-scale spatial data sets in R
- Global trends toward urban street-network sprawl
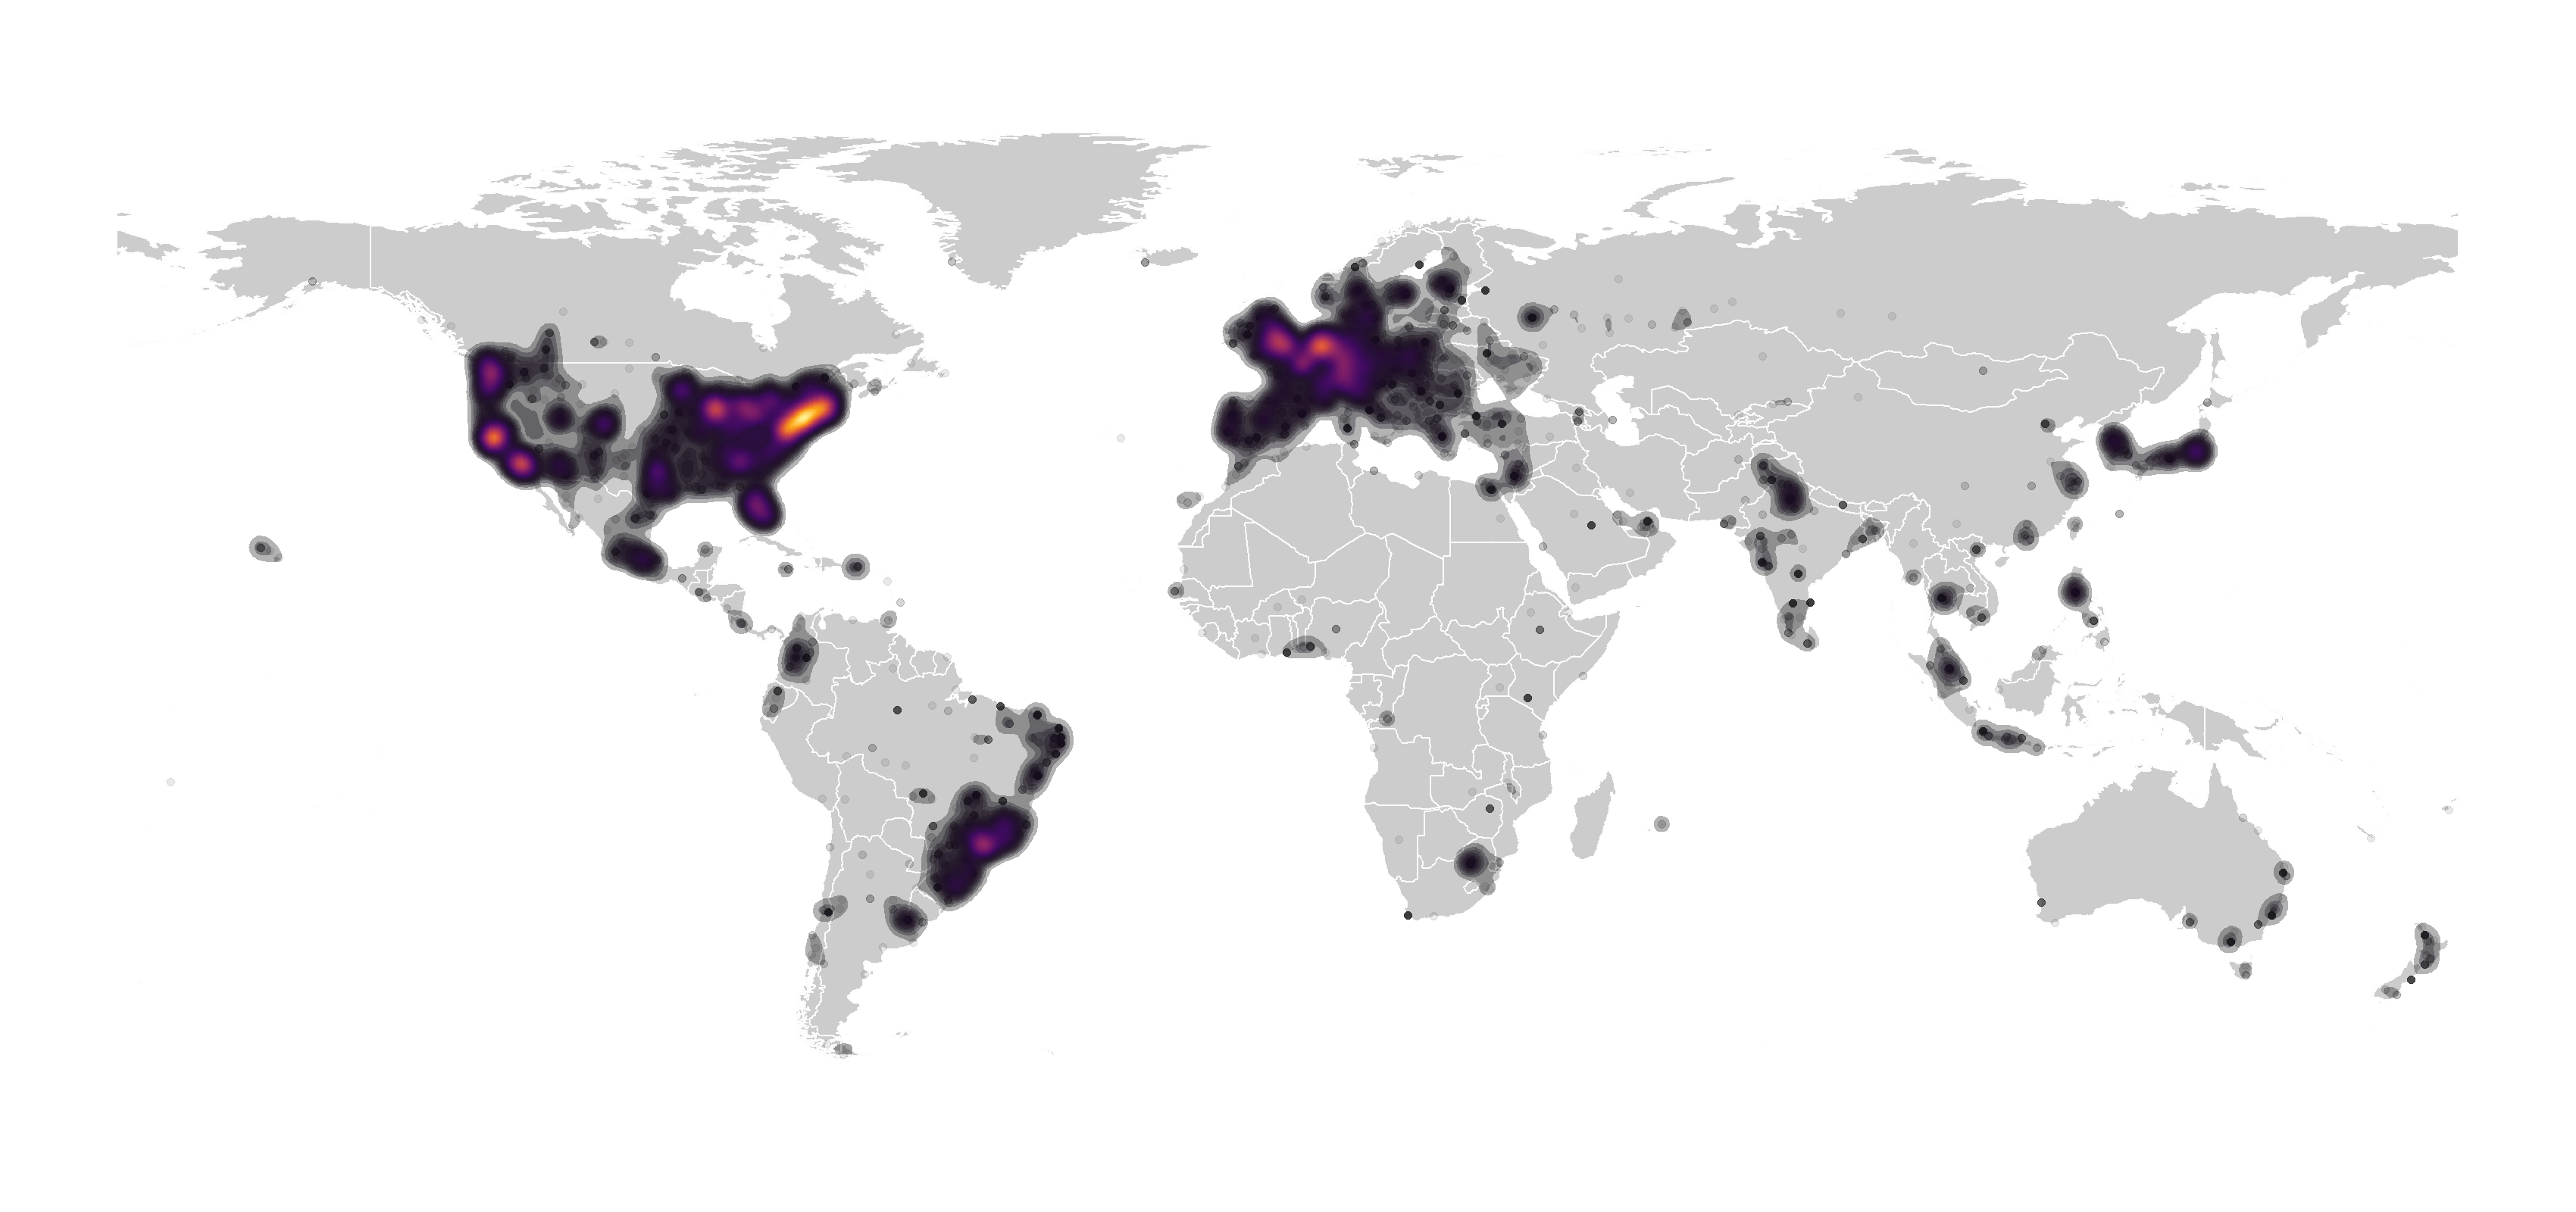
Where do readers come from? (156 countries | 2874 Cities)
- United States (30.2%)
- Brazil (21.1%)
- United Kingdom (05.6%)
- Germany (03.4%)
- Canada (03.0%)
- France (02.5%)
Here’s simple density map showing where our visitors come from: