11th Anniversary of Urban Demographics!
🎂
Quick post to celebrate the 11th anniversary of the Urban Demographics blog!
Not sure people still read blogs. Most of the info I get nowadays comes from Twitter, academic journals and LinkedIn (surprisingly). Over the past couple of years, I’ve also been more focused on trying to survive working on too many projects at the same time doing research. This means less procrastination time, and hence fewer posts on the blog as some of you will have noticed.
This is a bit reflected on the stats of Urban Demographics over the past year, so here you go:
- 45 posts, an average of ~0.8 posts per week
- 22,290 visits, an average of ~72 visits per day
- 13,578 followers on Twitter
- 3,516 likes/followers on Facebook
- new Instagram account with 298 followers.
- new LinkedIn account with 917 followers. Is this a thing?
- 702 RSS feed subscribers
The 5 most popular posts:
- Roads colored by orientation
- Open positions for research assistant
- r5r: Rapid Realistic Routing with R5 in R
- End the rainbow! Oh, wait
- The political economy of car dependence
and 5 of my favorite posts:
- Transportation Equity
- The glacial speed of academic journals
- Social and natural lottery of life
- Spatial, income and racial inequalities in access to COVID-19 healthcare
- Interactive elevation maps
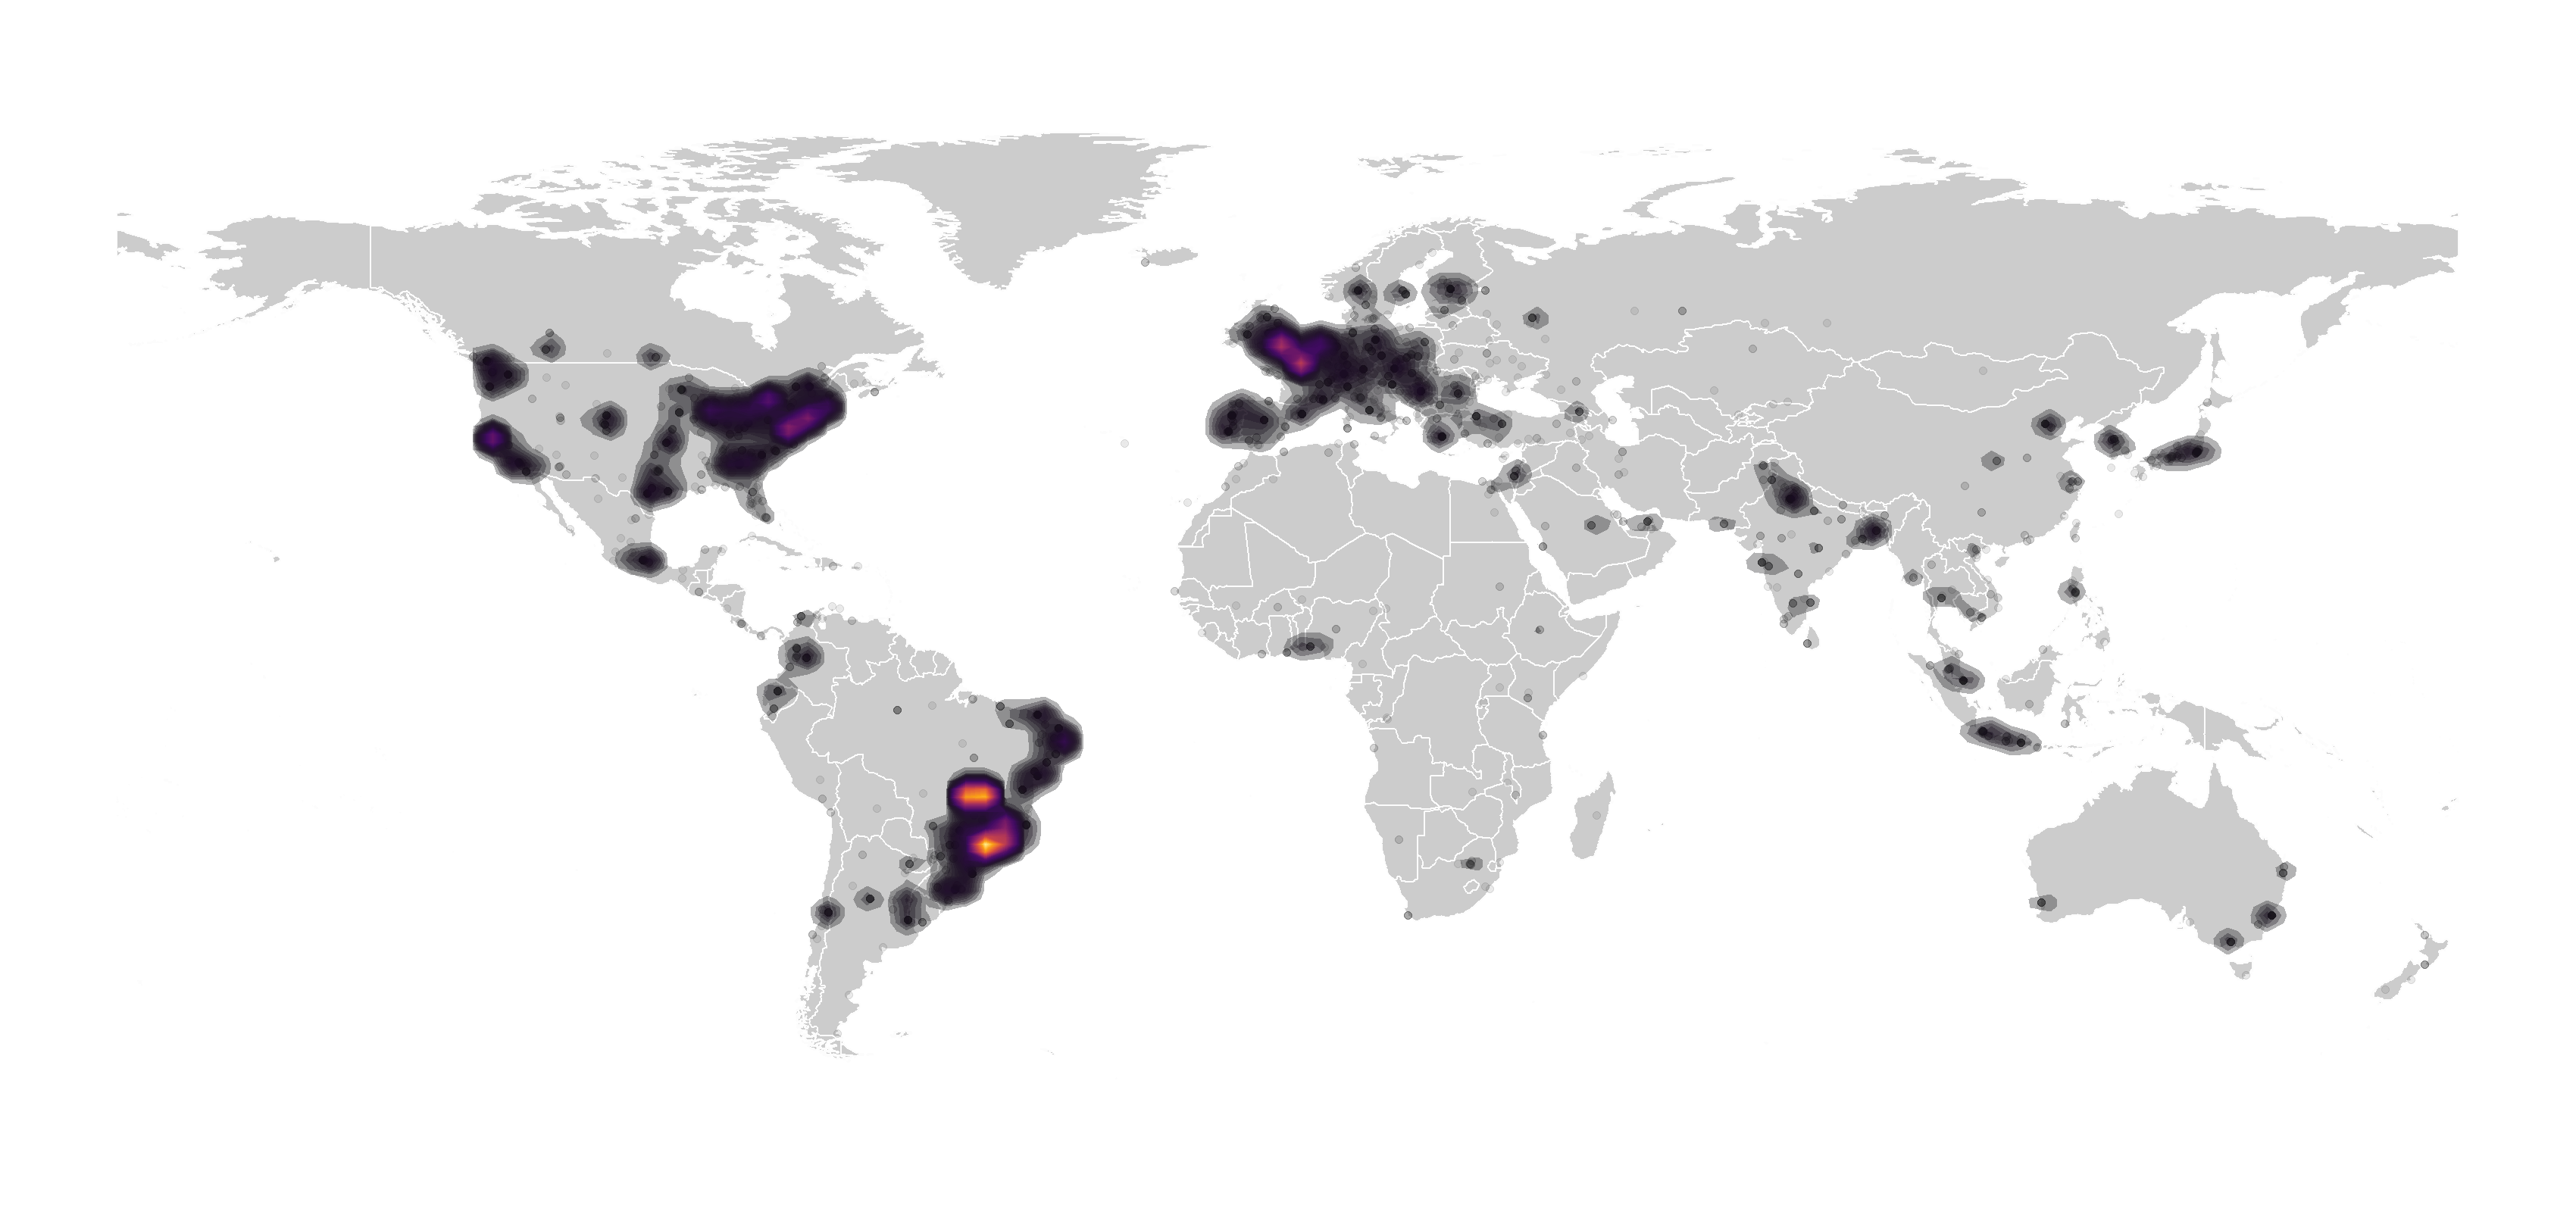
Where do readers come from? (136 countries | 1543 Cities)
- Brazil (30.0%)
- United States (24.2%)
- United Kingdom (05.0%)
- France (04.0%)
- Canada (04.0%)
- India (02.0%)
Here’s simple density map showing where our visitors come from. And here is the code to create a similar map using Google analytics data.